STRUCTURAL DESIGN OF A TUNNEL USING PHASE-2 ROCKSCIENCE_FEM
INPUTS
| Tunnel diameter = | 4.1 | m |
| Shape = | D-Shaped | m |
Rock Properties
| Failure Criterion = | Generalized Hoek-Brown | |
| Material type = | Plastic | |
| Geological Strength Index (GSI) = | 50 | MPa |
| Intact Rock Constant (\(m_i\)) = | 10 | |
| Distribution factor (\(D\)) = | 0 | |
| Young's modulus (\(E_i\)) = | 20000 | MPa |
| Intact compressive strength (\(σ_{ci}\))= | 100 | MPa |
Loadings
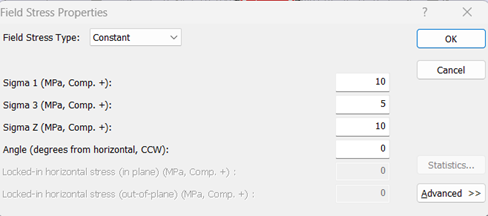
| Major stress (\(σ_1\)) = | 10 | MPa |
| Minor stress (\(σ_3\)) = | 5 | MPa |
| Minor stress (\(σ_2\)) = | 10 | MPa |
STEPS
1. Prepare section in AutoCAD (the section can be prepared in Phase2 as well but it is easier to do in AutoCAD). While preparing section use layer “Excavations” for the polyline used to prepare section. Then save as in “.DXF” format
2. In Phase2, go to file and click at Import to import the AutoCAD file.
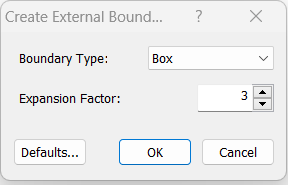
3. Go to “Boundaries” menu and then click at “Add External”. Then the following msgbox will be displayed. Click on “Box” in Boundary Type and Expansion factor as 3. Click “OK”
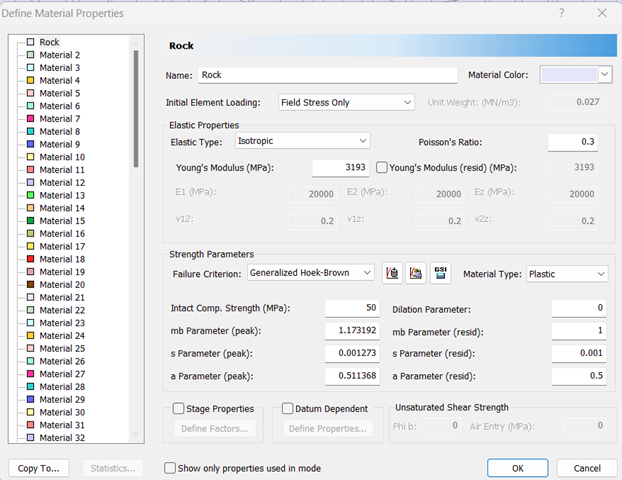
4. Right click at the material to provide material properties, click at “Material Properties”. Then edit/input the material as you require
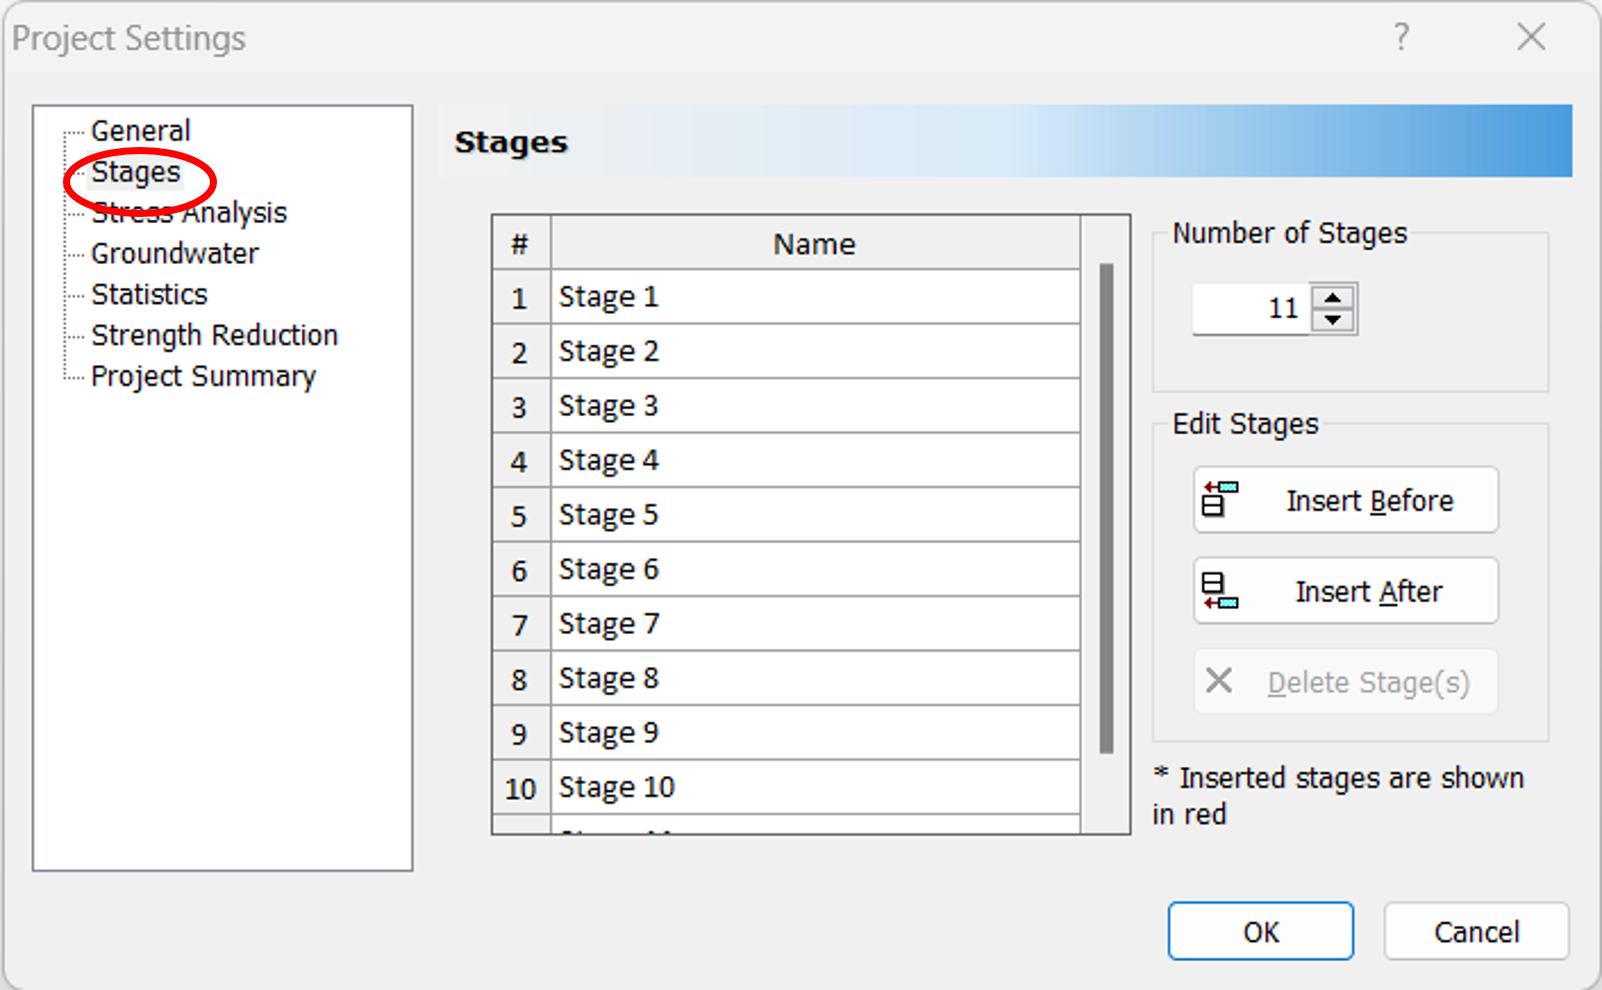
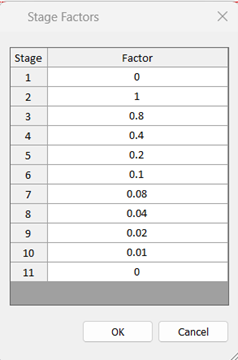
5. Go to “Analysis” menu and click at “Project Settings”. Then the following MsgBox will be displayed. Go to “Stages” and input 11in number of stages.
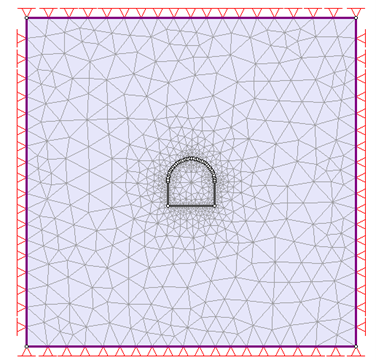
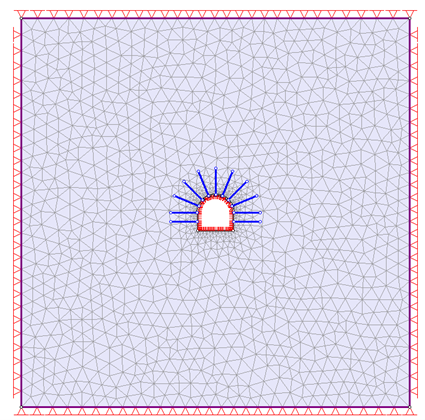
6. Go to “Mesh” menu and click at “Discretize and mesh”. The structure will appear like the image below.
7. Go to stage 2 and right click inside the section and click at assign material and then click "excavate".
8. Then go to “Loading” and click at “Field Stress”. Then the following msgbox will be displayed
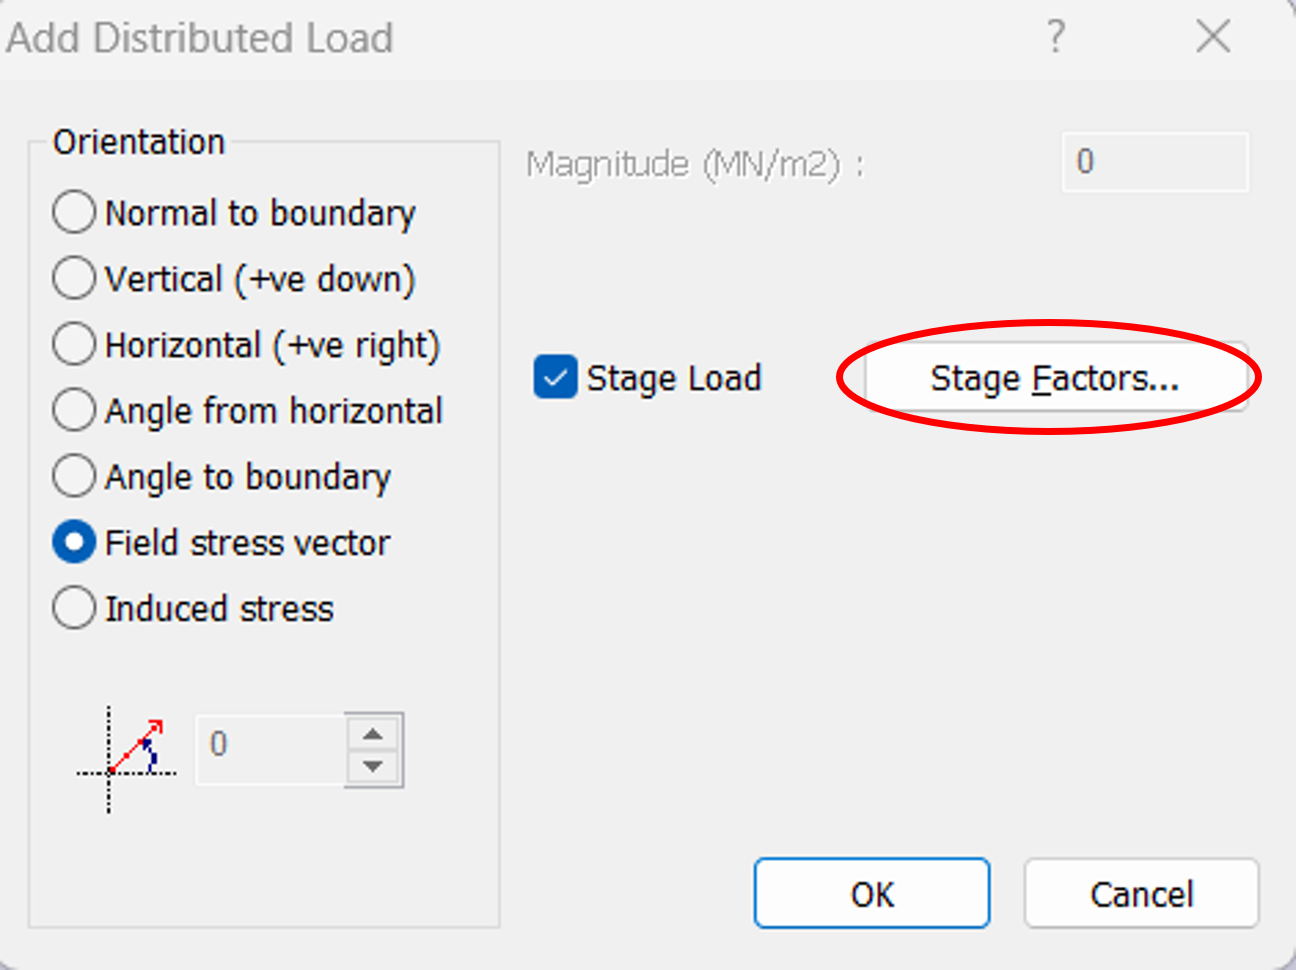
9. Now click on “Loading” and then click on Distributed load → Add uniform load Field stress vector → Click at stage.
Then, input the values as given below.
|
|
Then click on tunnel section.
10. Then go to “Analysis” and click on “Compute”.
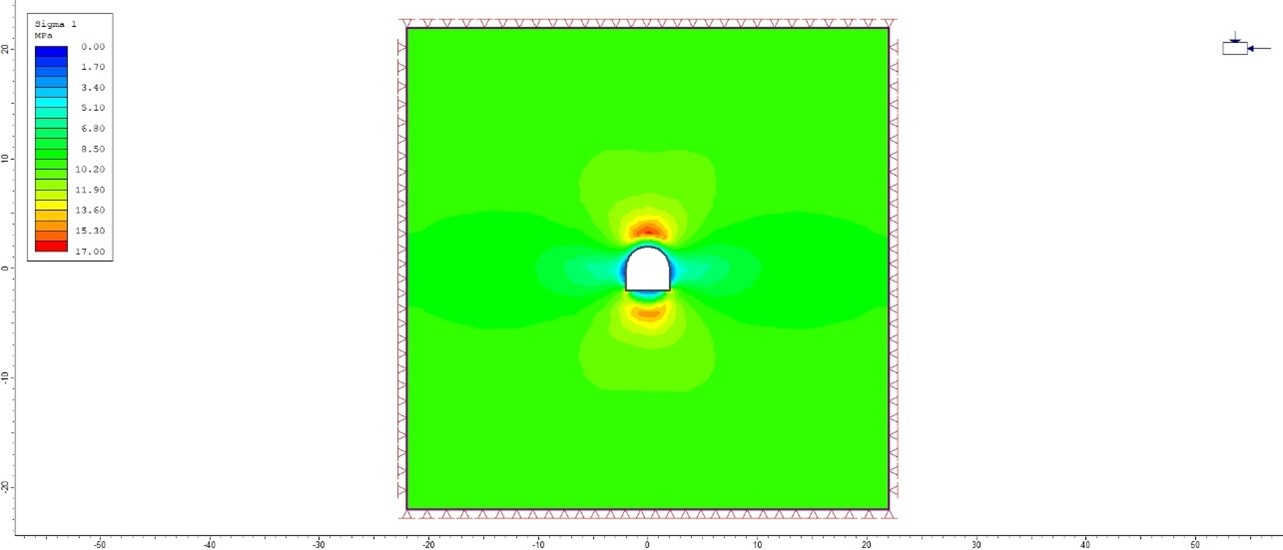
11. Then go to “Analysis” and click on “Interpret”.
Sigma σ1
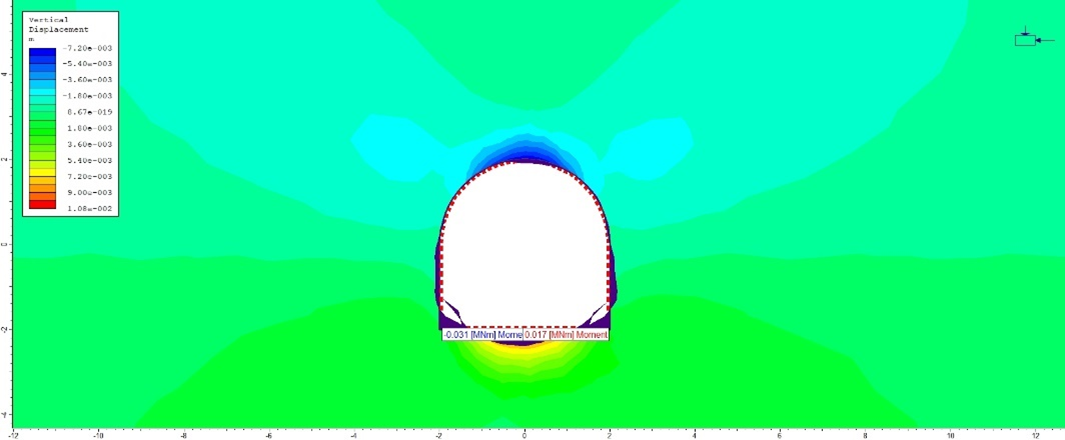
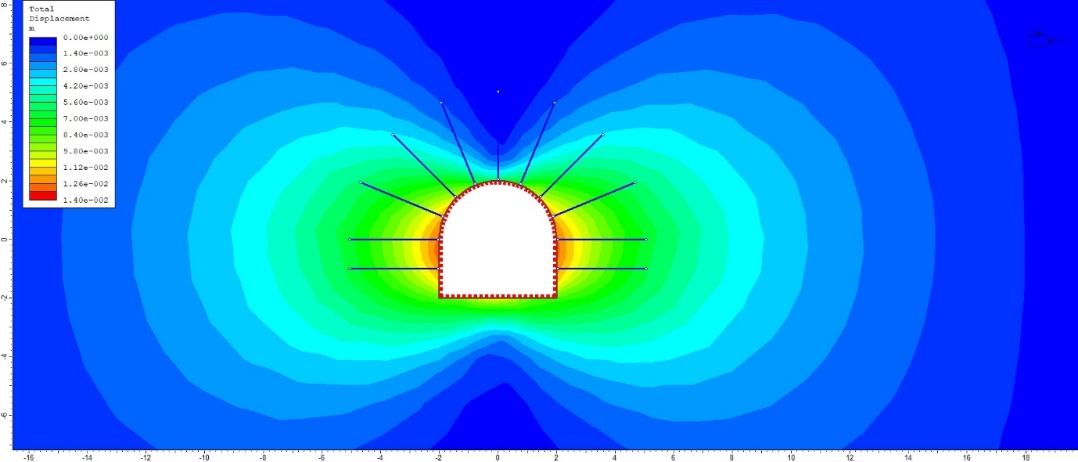
Total deflection.
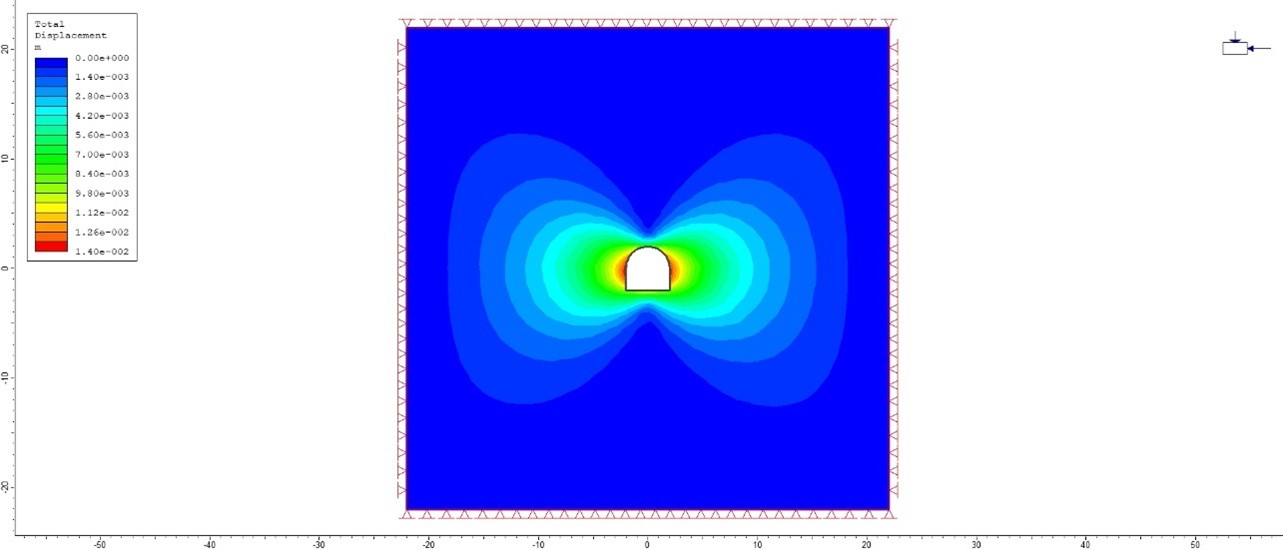
Total deflection = 0.01396m = 13.96mm.
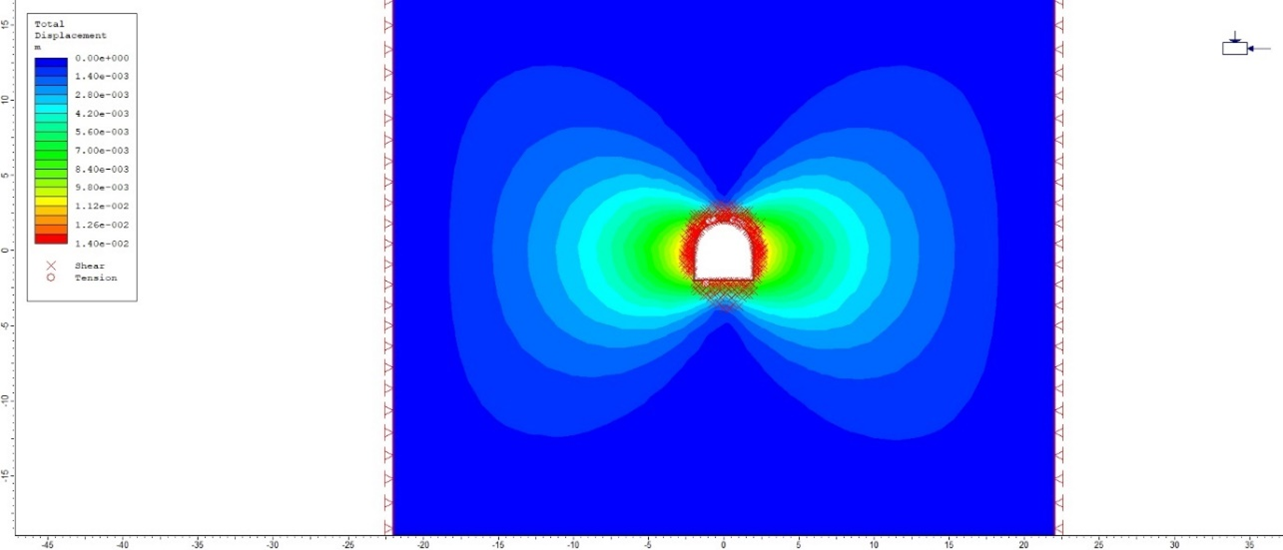
12. In interpret, go to “Analysis” and then click at show yield → Show yielded Elements.
Then the image will display like shown below.
Then Click “Measure”  provide coordinate of center of tunnel as the starting point of length.

Then click on “next” point farthest from center (radius of plastic zone, Rp).
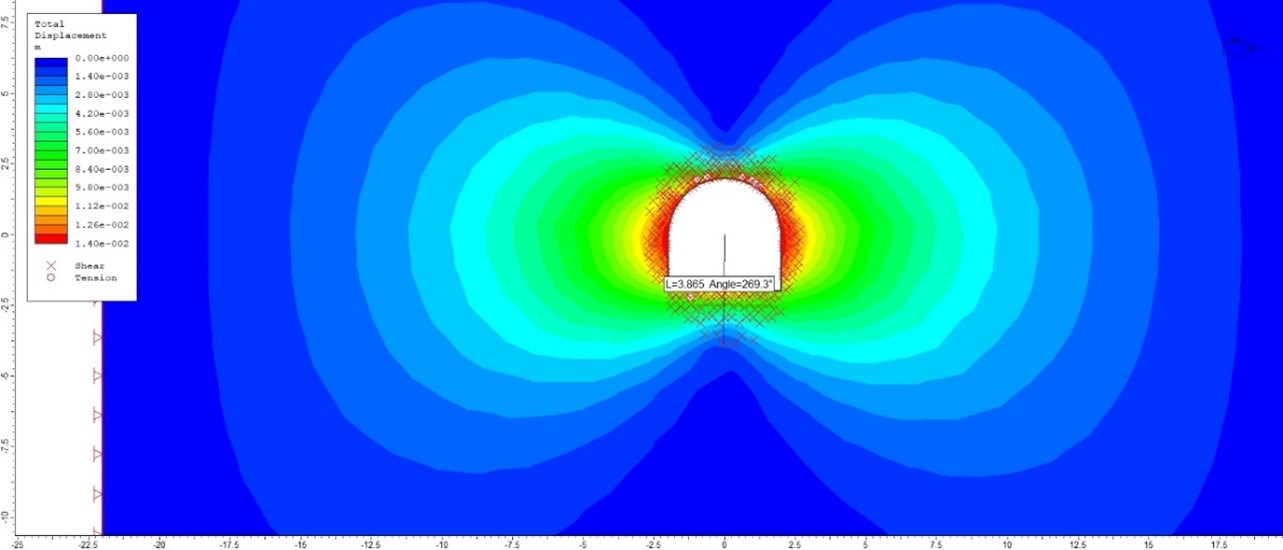
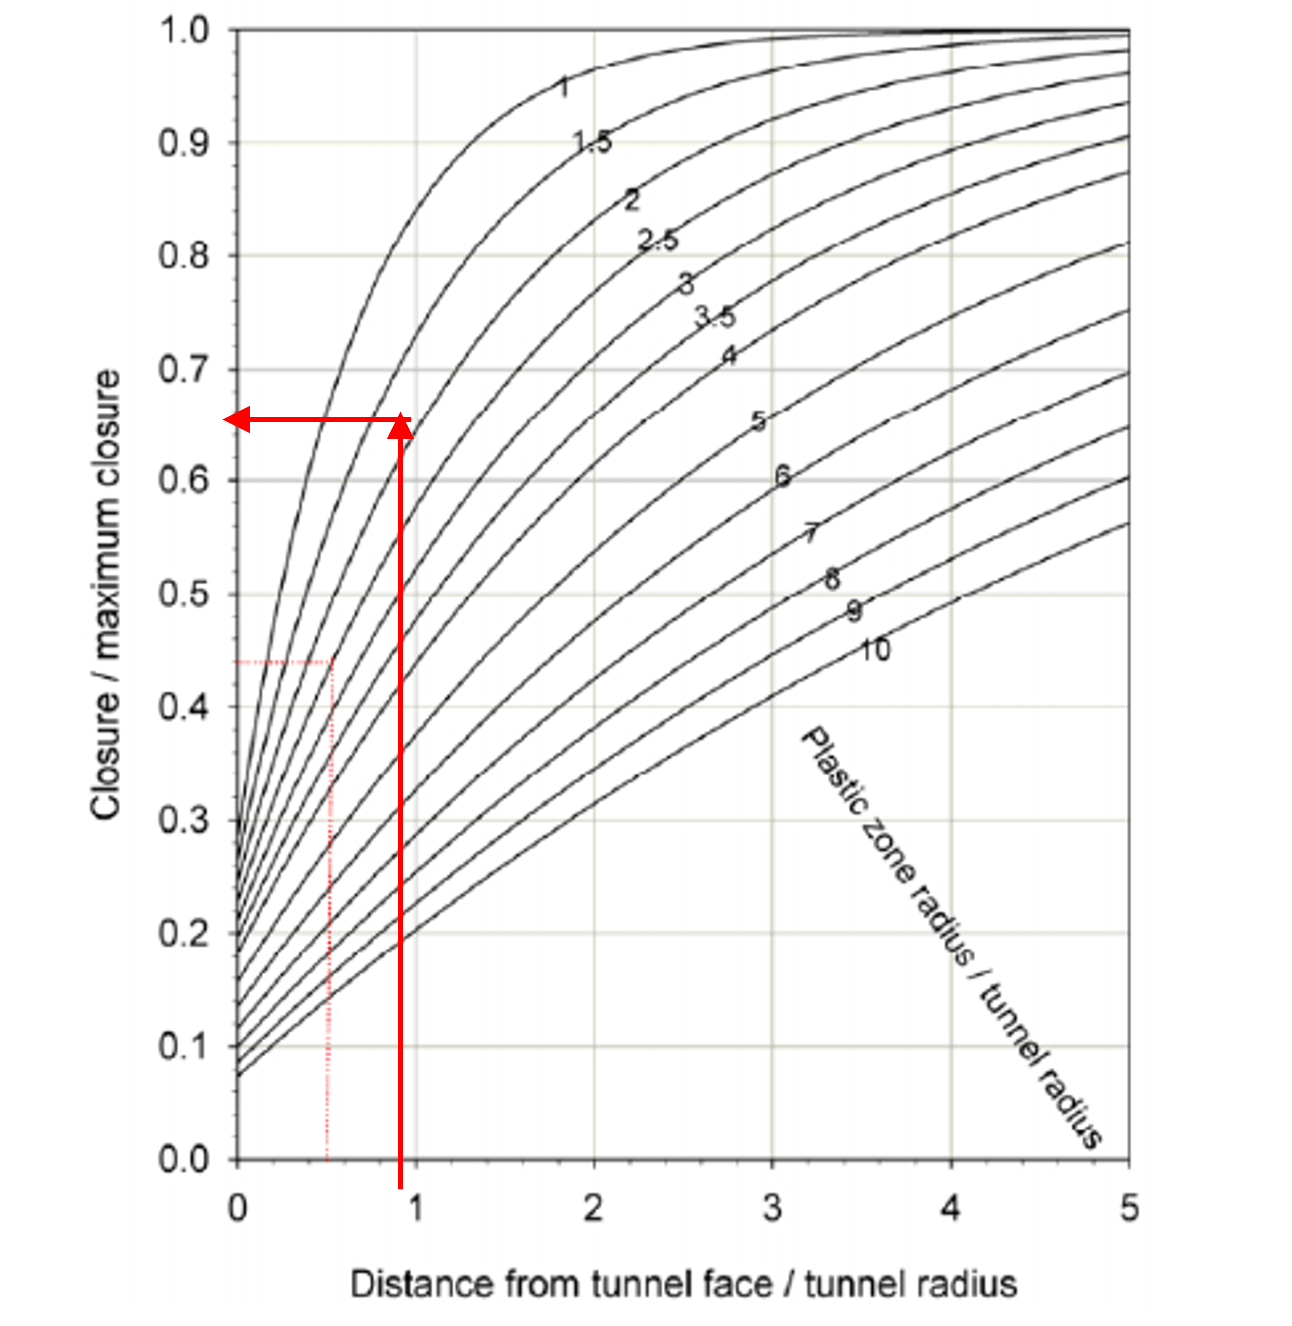
In this example, \( R_p = 3.865m \), \(R_t=\frac{4.1}{2}=2.05m\), \(X=2.0m\), and \(u_{max}=0.01396m\)
\(\frac{x}{R_t}=\frac{2.0}{2.05}=0.97\)\(\frac{R_p}{R_t}=\frac{3.865}{2.05}=1.88\)
Using Vlachopoulos and Diederichs Method
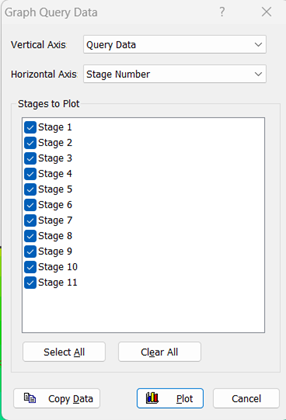
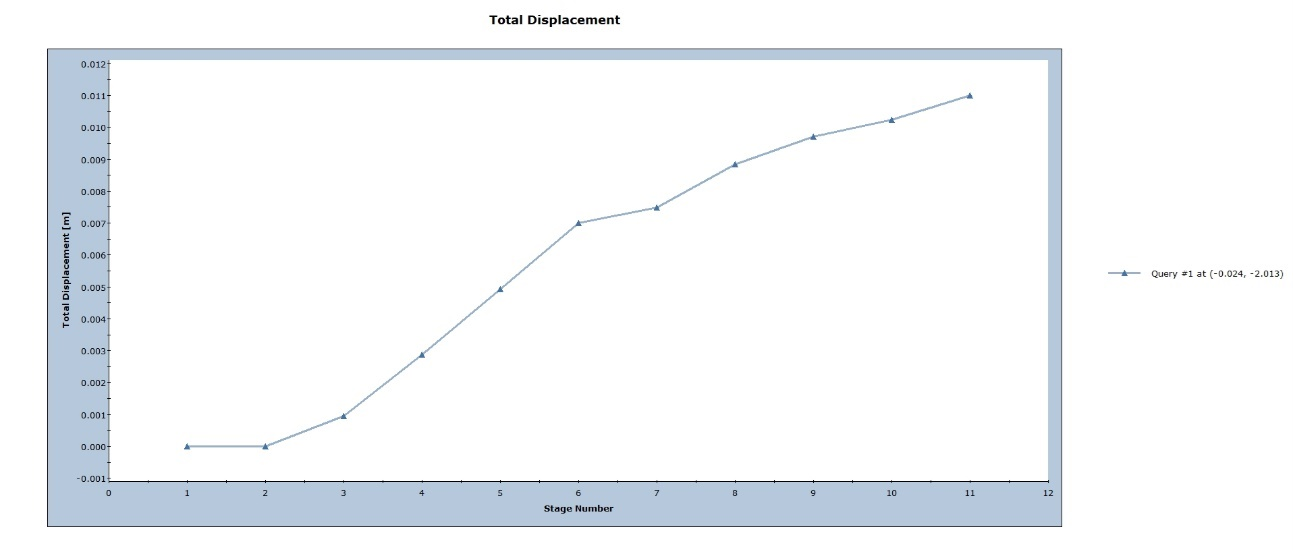
13. Go to “Graph” and then “Graph single point vs. stage”. Click at point where maximum displacement occurs. Then, the following msgbox will appear. Click “Plot”.
Then, the following graph will appear
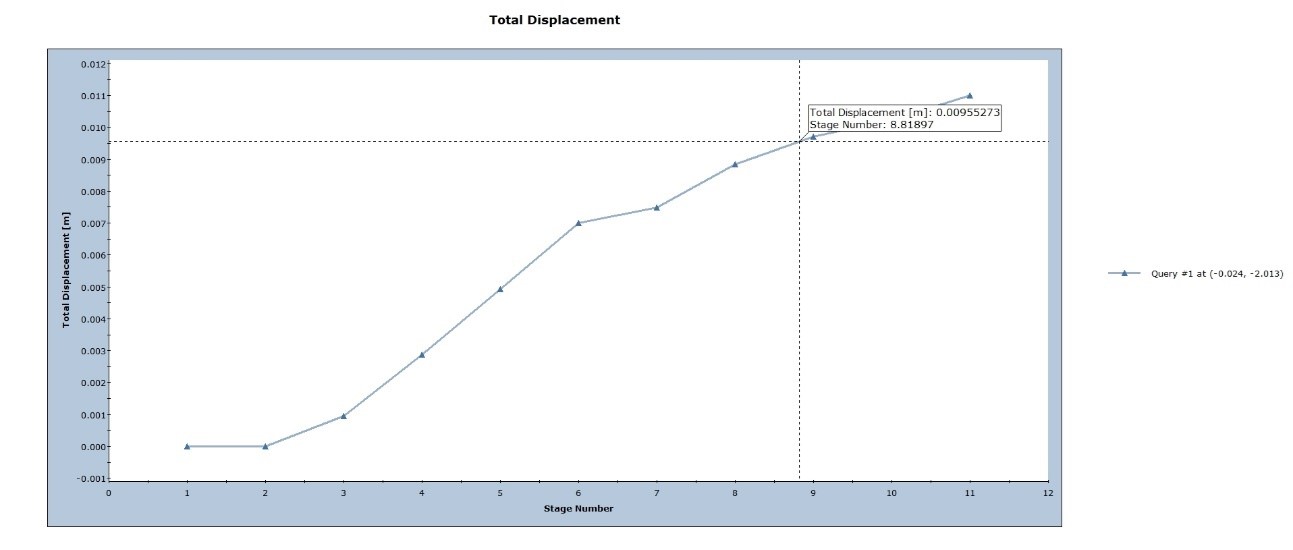
Right click, click on “Sampler” and then “show sampler”. Click on the graph when deflection equals to \(u_r=0.0095m\),and find the stage number corresponding to \(u_r\). In this case stage-9 is the required stage at which tunnel relaxes and support shall be installed.
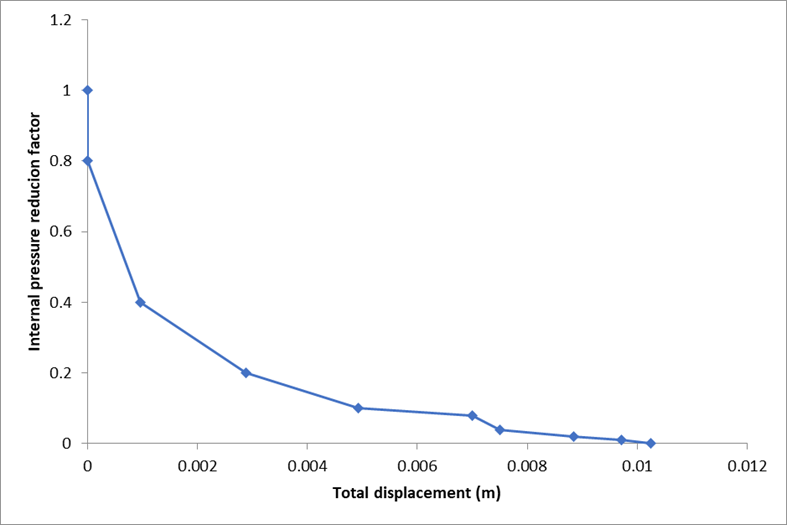
14. Creating convergence-confinement curve in excel.
Right click on graph and click at “Plot in excel”.
15. Revise the stages of internal pressure reduction factor. Go to Project Setting → Analysis → Stages. Remove all stage except below and revise internal pressure reduction factor as well.
| Stage no. | Internal pressure reduction factor |
| 1: Pre-excavation | 0 |
| 2: Initial stage | 1 |
| 3: Tunnel relaxation | 0.02 |
| 4: Support installed | 0.00 |
16. Analysis and interpret again.
17. For concrete lining: Go to modular again to add supports (lining, rock bolts). Go stage “Support installed” and then Click on “Support” menu and then “Add liner”. Following msgbox will appear. Click “OK”.
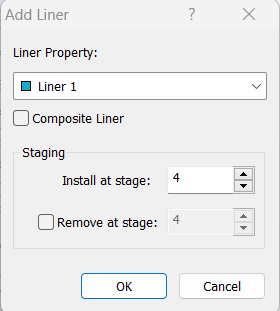
Then, click on section
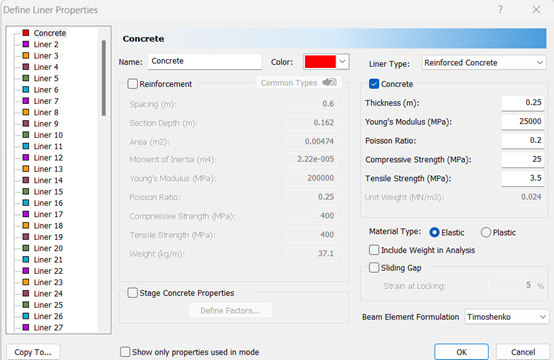
Provide liner properties.
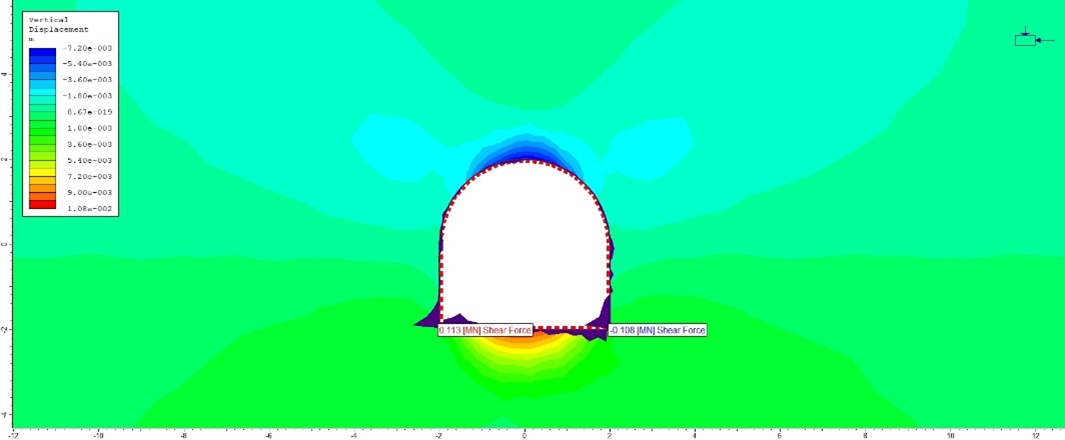
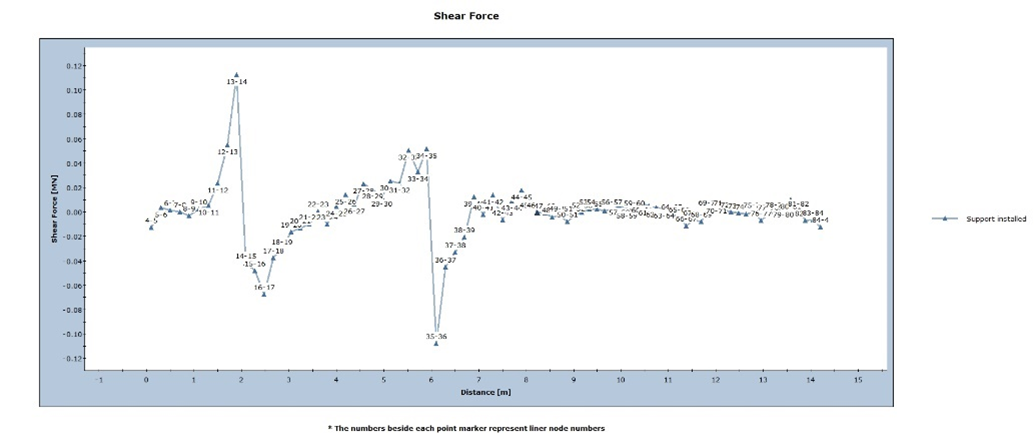
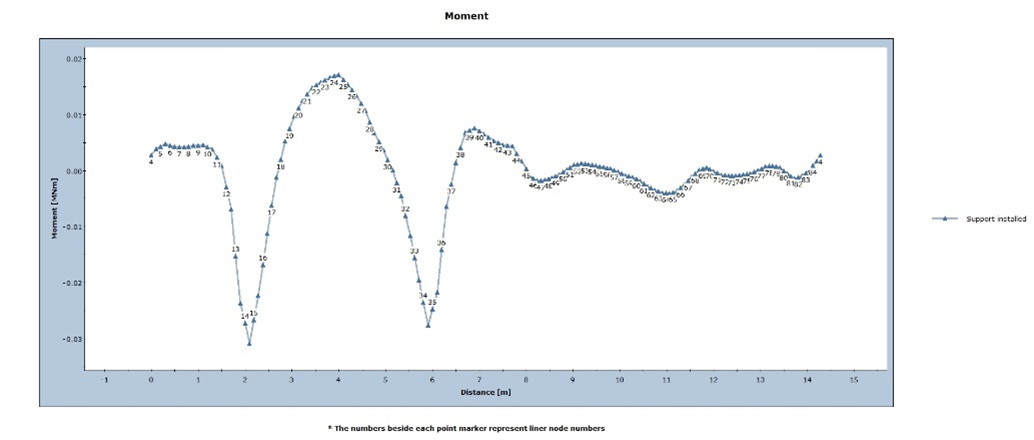
In addition to changed deflection, bending moments, shear force and axial force at lining can be evaluated from the analysis.
For Shear forces, Bending moments
At interpret, click at “Show values”  . Then, the following msgbox will appear. Bending moment, shear force as per requirement.
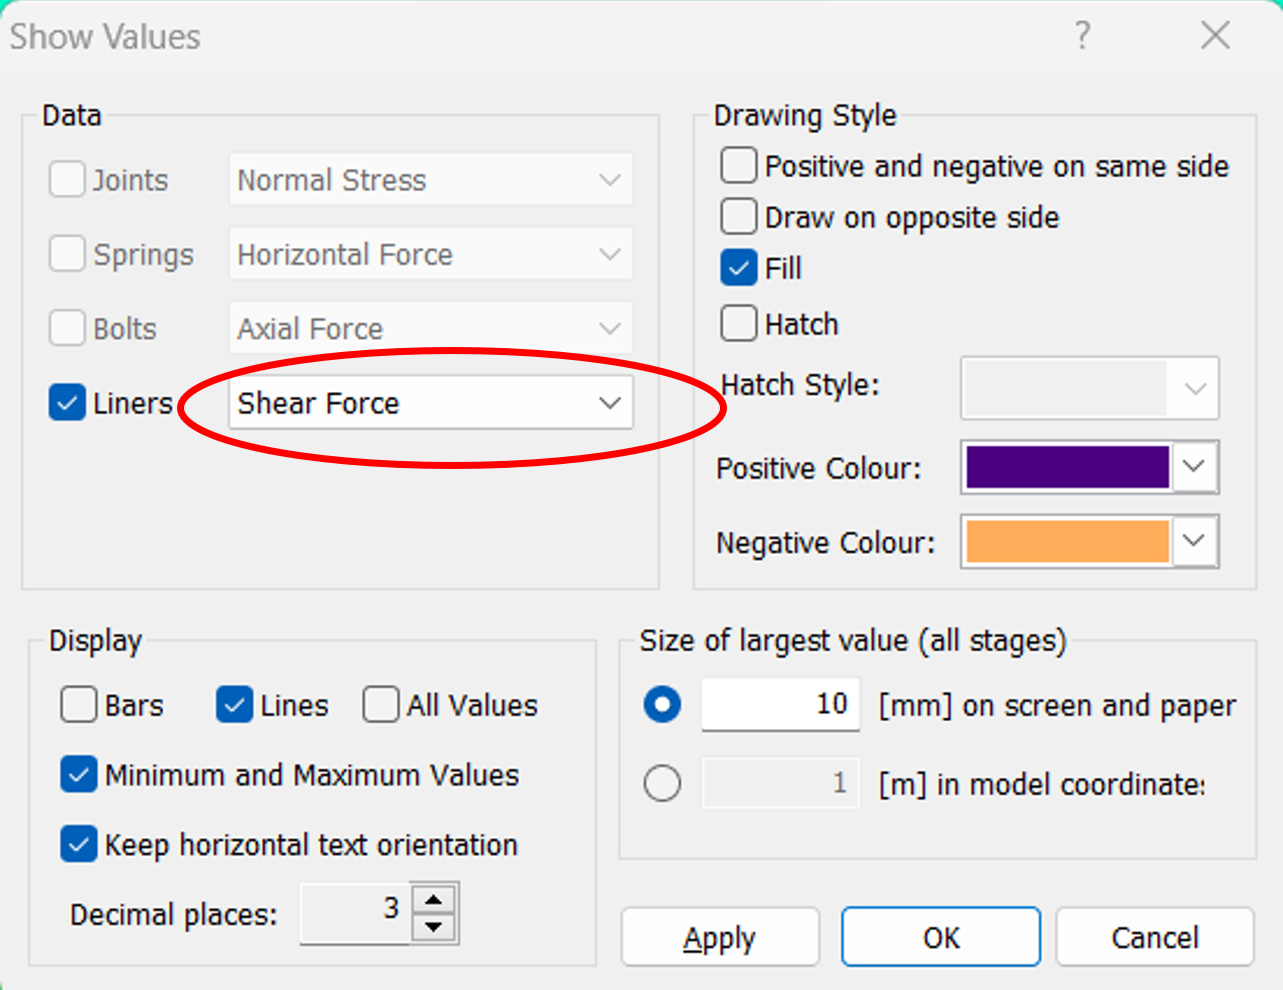
Shear force
Bending Moment
Check for strength as per factor of safety.
At interpret windows, go to “Graph” → Click at Support Capacity Plots or click  . Following msgbox will appear. Click number of envelopes 3 with factors of safety 1.0, 1.2 and 1.4. Support element as Liner or rock bolts as per the necessity.
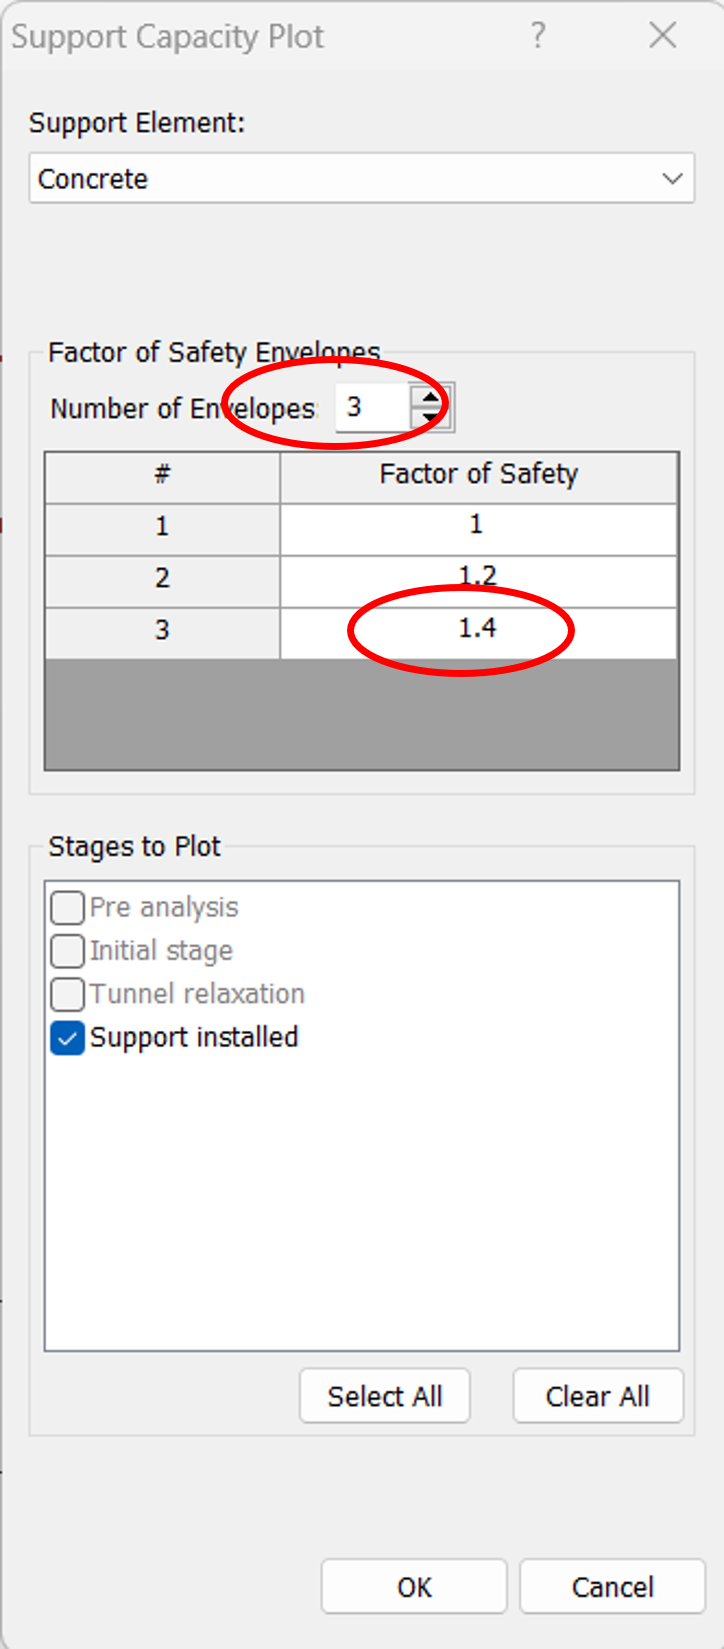
Results are displayed as given in following image.
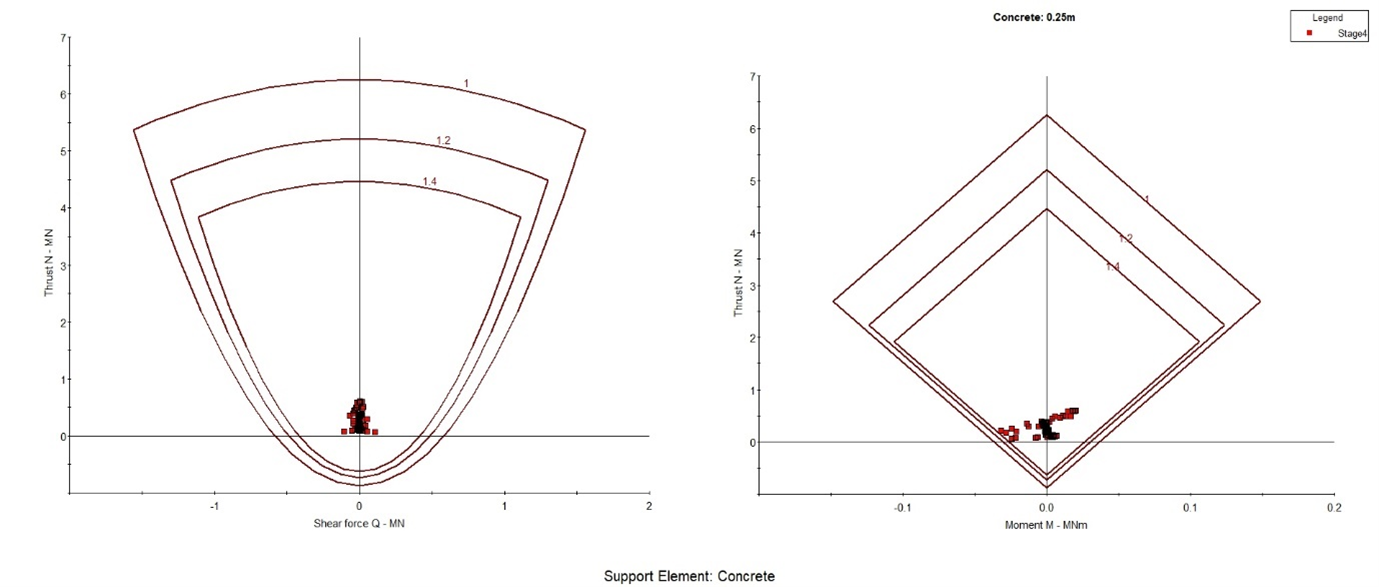
If all points are within the limit of factor of safety, then the assumption of supports are okay. If not, we should change the support properties.
If provide rockbolts.
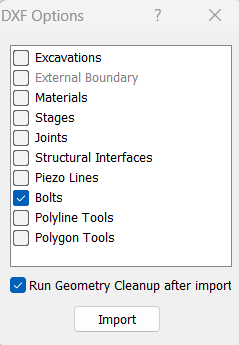
Make bolts in AutoCAD and save as in .DXF format. But the layer of bolts shall be in “Bolts”. The bolts can be made in Phase2 as well using “Support” → Add Bolts or Add Bolt Pattern.
Adding bolts from .DXF file, first go to file menu → Import→Import ".DXF". Then following msgbox will appear. Click at “Bolts” and click “OK”, then insert the file of bolts.
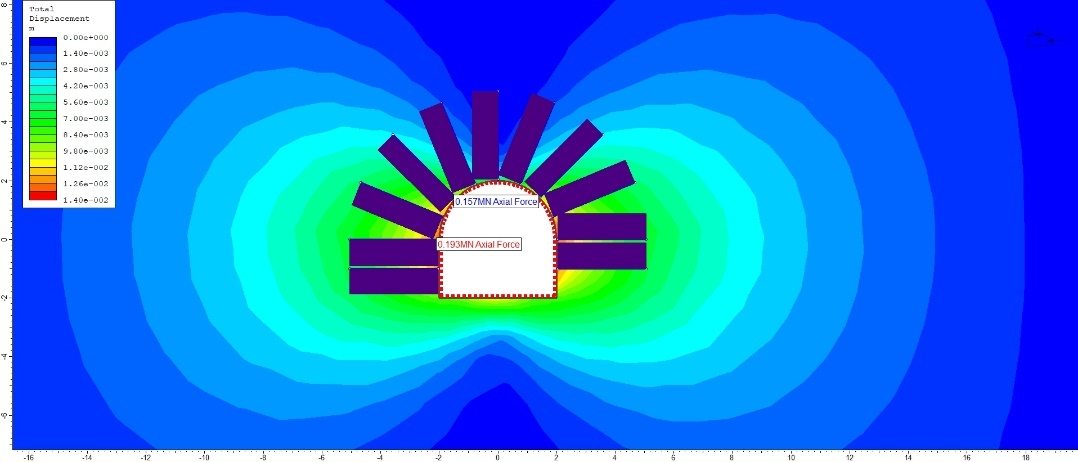
Now, the rock bolts will be inserted in the design and look like the one below.
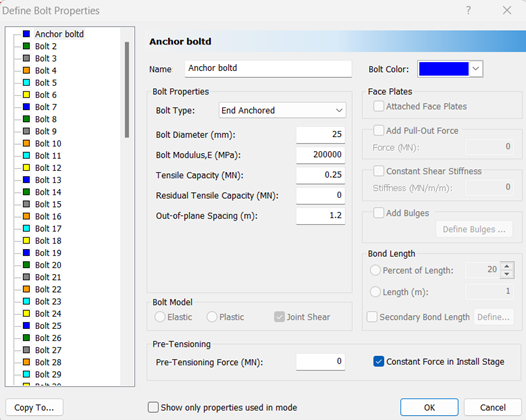
Then we have to add Bolts properties. Go to “Properties” → Click “Define Bolts”. The following msgbox will be displayed.
Then, do analysis and interpret.
Total deflection at support installed is given as follows.
Maximum "total deflection after installation of liner and bolts is now" 13.08mm compared to 13.96mm without support installation.
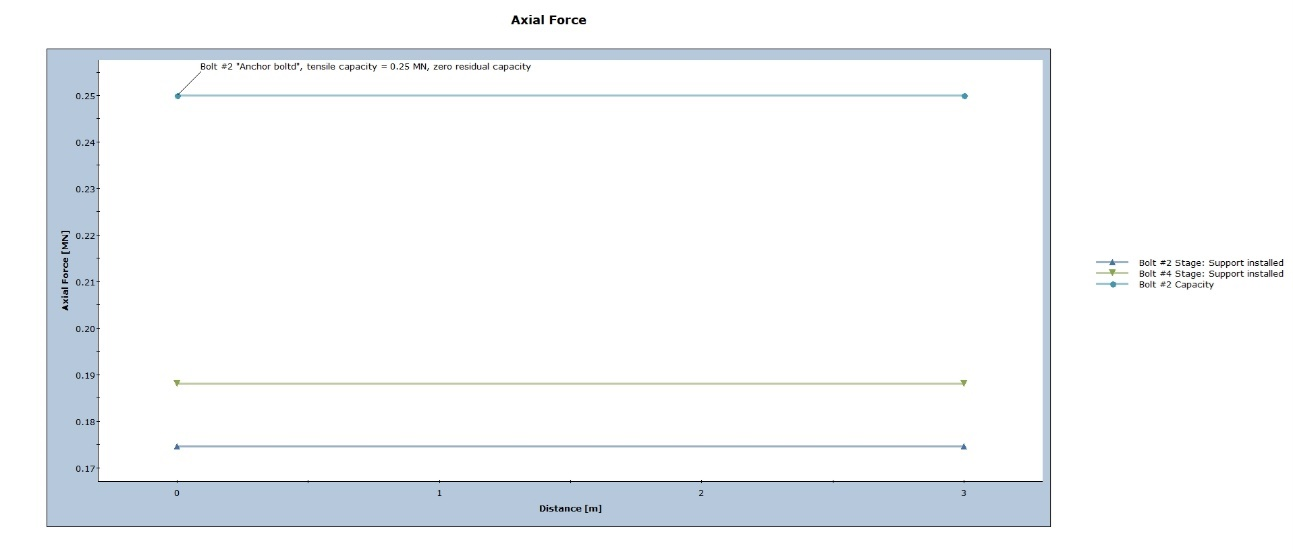
Axial force in rock bolts are given as below.
Axial force and stress of individual bolts can be found by clicking “Graph Bolt Data” 
The processes of adding support shall be repeated until the section are in within the factor of safety.