PREPARATION OF INTERACTION DIAGRAM AS PER BS 8110: 1997
Input parameters.
| Concrete grade | \(f_{cu}\) |
| Steel grade | \(f_{y}\) |
| Modulus of Elasticity | \(E_s\) |
| Effective cover | \(d'\) |
| Axial force | \(N\) |
| Moment at x-axis | \(M_x\) |
| Moment at y-axis | \(M_y\) |
| Shorter dimension | \(b\) |
| Longer dimension | \(h\) |
| Effective width | \(b'=b-d'\) |
| Effective depth | \(h'=h-d'\) |
| Percentage of reinforcement | \(p\) |
| No. of rows | \(n_r\) |
| Number of reinforcement | \(n\) |
| Spacing of reinforcement | \(S_b\) |
The following conditions shall be fulfilled to prepare the interaction diagram.
i) When neutral axis lies in the section.

Computation of strains
Strain of compression bars
And
And so on........depending upon the number of rows of rebar where \(\varepsilon_{cu} = 0.0035\)
Strain at tensile reinforcement
Computation of Stresses
At compression rebar
If \(f_{sc1}\geq 0.87f_y\), then
Else
And
If \(f_{sc2}\geq 0.87f_y\), then
Else
And so on........depending upon the number of rows of rebar.
At tension rebar
If \(f_{st}\geq 0.87f_y \) then
Else
Computation of forces
Of Concrete:
and therefore
\(F_{cc}=0.405f_{cu}bx \)Of Compression rebar
And
And so on……depending on the number of rows of rebar
Of tension rebars
Resultant forces in concrete
Calculation of moment capacities (Taking moment at center of the section).
Of Compression rebar
And
Of Concrete
Where \(s=0.9x\)
Of Tension rebar
\(M=M_1+M_2+M_c+M_s \)
ii) When neutral axis lies outside the section

Computation of Strains
Row-1
Row-2
And so on......
Note: all the rebars are on compression side.
Computation of Stresses
Row-1
But not greater than \(0.87f_y\).
Row-2
But not greater than \(0.87f_y\).
And so on......
Compression forces
Row-1
Row-2
And so on......
Compressive stress of Concrete
Total force at the section
Moment at the center of the section
\(M_2=F_{sc2}(\frac{h}{2}-d'-(i-1)S_b)\)
And so on............
Total Moment
The moment due to rows of reinforcement below half of the section shall be deducted.
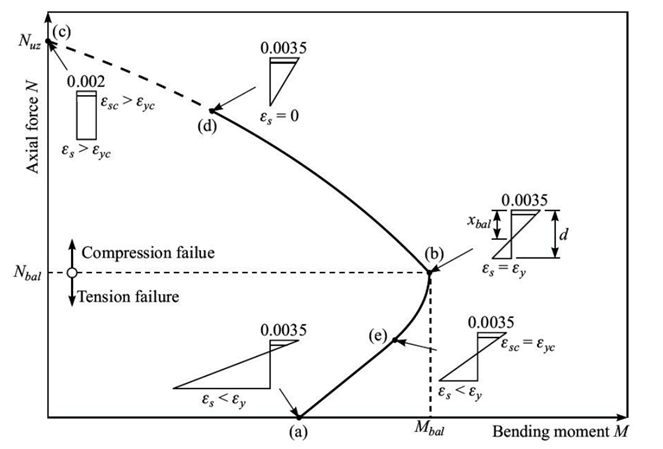
Description of interaction diagram
a) Pure bending
This point represents that of a beam in bending. Note that the presence of a small axial force will generally increase the moment capacity of a beam
b) Balanced point
This is the point where the concrete reaches its ultimate strain at the same time the tension reinforcement yields. For combinations of N and M that will fall below the balance point, the failure mode is ductile with the reinforcement yielding before the concrete fails in compression. Otherwise, failure mode is brittle; the concrete crushes without yielding of the tension reinforcement. Unfortunately, the failure mode in a column can’t be controlled by reinforcement quantities as it can be in beams.
c) Pure axial compression
At this point, the column is subjected to an axial force with only M=0. The capacity of the section is equal to Nuz. Note that the tension reinforcement in compression for this case.
d) Zero strain in the tension reinforcement
Moving from point (b) to point (c) the neutral axis increases from xbal to infinity as N increases. The strain in the tension reinforcement changes from yielding in tension to yielding in compression, passing through zero at point (d). Moving from points (d) to (c) the neutral axis will fall outside the section and the strain distribution will eventually change from triangular to uniform.
Between points (b) and (c) an increase in axial load N will lead to a smaller moment capacity M at failure. Conversely, below the balance point an increase in N increases will increase the moment capacity of the section.
e) Yielding of the compression reinforcement
As the axial force N increases and the neutral axis x increases, the strain in compression reinforcement will often change from elastic to yielding. This will clearly be influenced by the strength of the reinforcement and its position within the section. This point will typically correspond to a change in slope of interaction diagram as shown at point (e).
DESIGN EXAMPLE
INPUTS
| Concrete grade | \(f_{ck}=25N/mm^2\) |
| Steel grade | \(f_{ck}=415N/mm^2\) |
| Modulus of Elasticity | \(E_s=200000 N/mm^2\) |
| Effective cover | \(d'=37.5mm\) |
| Axial Force | \(F=500kN\) |
| Moment at x-axis | \(M_x=50kNm\) |
| Moment at y-axis | \(M_y=75kNm\) |
| Unsupported length | \(L=3m\) |
| Type of column | \(Braced\) |
| End Condition (Top) | \(Fixed\) |
| End Condition (Bottom) | \(Fixed\) |
| Width | \(b=400mm\) |
| Depth | \(h=400mm\) |
| Effective Width | \(b'=362.5mm\) |
| Effective Depth | \(h'=362.5mm\) |
| Percentage of reinforcement | \(p=3%\) |
| Number of rows | \(n_r=4\) |
| Number of rebar | \(n=12\) |
| Spacing of rebar | \(S_b=108.33mm\) |
| Diamter of rebar | \(\phi=25 mm\) |
CALCULATION
Effective length coefficient \(beta=0.75\)
Effective length \(L_e=\beta L=0.75×3.0=2.25m \)
Check for long or short column, for braced column
So, the column is short
Ratio of effective depth to overall depth
Minimum Eccentricity
| Direction | Eccentricity | Check for column design | |
|---|---|---|---|
| Geometry | Forces | ||
| In width |
=min(0.05b,20)
=min(0.05×400,20)
=min(20,20)
=20mm
|
=Mₓ/N=50/500×1000
=100mm
|
Since eccentricity due to forces are greater than minimum eccentricity, biaxial column shall be considered for the design |
| In depth |
=min(0.05b,20)
=min(0.05×400,20)
=min(20,20)
=20mm
|
=Mᵧ/N=75/500×1000
=150mm
|
|
Check for dominancy of the moments in the axes.
In width
Moment per width
In depth
Moment per width
Check for dominancy
Since \(\frac{M_y}{h'}>\frac{M_x}{b'}\) , \(M_y\) dominance over \(M_x\).
Multiplying factor \(\beta\) shall be calculated using following table
| \(\frac{N}{f_{cu}bh}\) | 0 | 0.1 | 0.2 | 0.3 | 0.4 | 0.5 | 0.6 |
|---|---|---|---|---|---|---|---|
| \(\beta\) | 1 | 0.88 | 0.77 | 0.65 | 0.53 | 0.42 | 0.30 |
So, \(\beta = 0.853\)
Design moment
\(Since,\frac{M_y}{b'}>\frac{M_x}{h'}\), then \(M'_y=M_y+\beta\frac{b'}{h'}M_x \)
\(M'_y=75+0.853×\frac{362.5}{362.5}×75=117.625kNm \)Preparation of Interaction diagram

A. In Width (X-Chart)
Reinforcement distribution (Equally distributed in all side) in rows and columns
| Row no. | Diameter | Numbers | Cross-Sectional area | Cummulative area | Distance from top |
|---|---|---|---|---|---|
| 1 | 25 | 4 | 1963.50 | 1963.50 | 37.5 |
| 2 | 25 | 2 | 981.75 | 2945.24 | 145.83 |
| 3 | 25 | 2 | 981.75 | 3926.99 | 254.17 |
| 4 | 25 | 4 | 1963.50 | 5890.49 | 362.50 |
Spacing of neutral axis from top
Start of NA, \(x_1=0.05\)
Condition-1: When neutral axis lies in section
For example \(x=0.35m\)
Strain:
Stress:
If \(\varepsilon\leq\frac{0.87f_y}{E_s}\) then
Else
Calculation of Strain and stress at each rows of the rebar
| Row no. | Distance of NA to rebar (y) (mm) | Strain | Stress(N/mm2 |
|---|---|---|---|
| 1 | =350-37.5=321.5 | \(=\frac{0.0035}{350}312.5=0.0031 \) | \(=361.05\) |
| 2 | =204.17 | =0.002 | =361.05 |
| 3 | =95.83 | =0.00026 | =191.66 |
| 4 | =-12.5 | =-0.00012 | =-25 |
Negative sign indicates the tension reinforcement
Calculation of compressive and tensile forces
Compressive force of concrete
Compressive/Tensile force of steel
CALCULATION TABLE
| Row no | Force (kN) | Forces | ||
|---|---|---|---|---|
| Concrete | Compressive force | Tensile force | ||
| 1 | =0.45×25×400×315=1417.5 | =(fsc1-0.45fcu) Asc1 =(361.05-0.45×25)×1963.50 =686.83 |
- | |
| 2 | =(361.05-0.45×25)×981.75 =343.41 |
- | ||
| 3 | =(191.66-0.45×25)×981.75 =177.12 |
- | ||
| 4 | =(fsc1-0.45fcu) Asc1 =(25-0.45×25)×1963.50 =27.00 |
|||
| Total force = 2597.86 kN | ||||
Bending moments
| Row no | Force (kN) | Forces | ||
|---|---|---|---|---|
| Concrete | Compressive force | Tensile force | ||
| 1 | =0.45×25×400×315=1417.5 | =(fsc1-0.45fcu) Asc1 =(361.05-0.45×25)×1963.50 =686.83 |
- | |
| 2 | =(361.05-0.45×25)×981.75 =343.41 |
- | ||
| 3 | =(191.66-0.45×25)×981.75 =177.12 |
- | ||
| 4 | =(fsc1-0.45fcu) Asc1 =(25-0.45×25)×1963.50 =27.00 |
|||
| Total force = 2597.86 kN | ||||
Similar process shall be carried out different positions of neutral axis. In case of neutral axis lies outside of the sections, the summation of forces and moments are carried out by following formula
\(M_i=F_{sci}(\frac{h}{2}-d'-(i-1)S_b)\)
And so on....
\(M_c=0\)Total moment
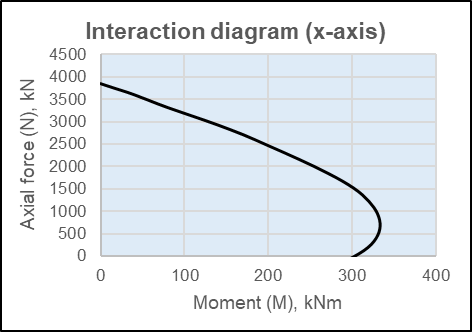
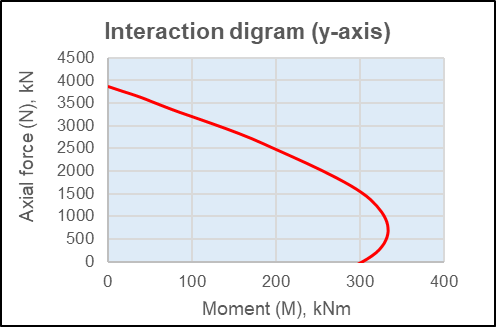
A similar process shall be followed in another axis as well. After doing detailed calculations, following interaction diagram has been achieved.
Check for linear approximation
Moment at x-axis for \(N=500kN\), \(M_{ux}=320.55kNm\)
Similarly, Moment at y-axis for \(N=500kN\), \(M_{uy}=320.55kNm\)
Result: Assumption of 3% of reinforcement is okay for this section.